Market Update August 2015
Clear Title of Arizona is pleased to provide its clients with the Clear Connections Monthly Market Update. This report will provide you with the latest real estate trends.
Our business is built around the concept of educating and providing the personal service that Real Estate Agents and Lenders have come to depend upon. It is with this philosophy that we offer data from the ASU W.P. Carey School of Business to our clients, associates and friends. It is intended to keep you informed on critical market trends that affect our businesses.
Please visit http://research.wpcarey.asu.edu/real-estate/residential-overview/ for a complete breakdown of the current real estate housing market.
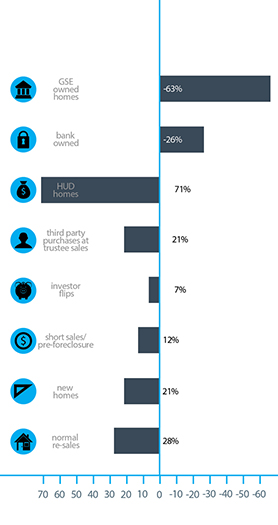 Single family homes sales increased year over year in three sectors:
- Normal re-sales (up 28%)
- New homes (up 21%)
- Short sales and pre-foreclosures (up 12%)
- Investor flips (up 7%)
- Third party purchases at trustee sale (up 21%)
- HUD sales (up 71% – but from a very small base)
Single family home sales decreased year over year across just two sectors:
- Bank owned homes (down 26%)
- GSE (Fannie Mae, Freddie Mac, etc.) owned homes (down 63%)
The change in total dollars spent on homes was more favorable than the change in the unit count.
- Total dollars spent on single family homes rose by 27% above June 2014.
- Total dollars spent on townhouses & condos rose by 30% above June 2014
Overall pricing for single family homes has been very stable for much of the last 18 months, but has gained some upward momentum over the last quarter.
Median Sales Price
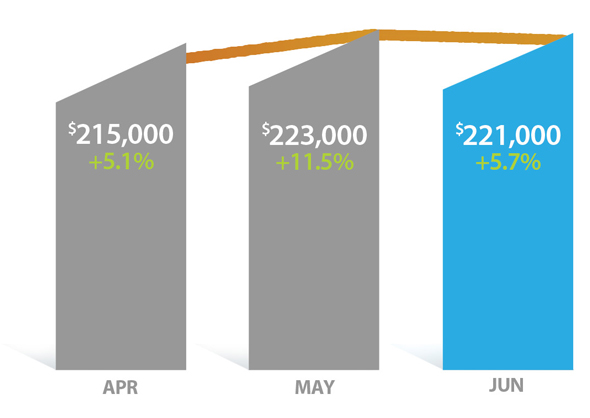
The median sales price was up 5.7% from $209,000 in June 2014 to $221,000 in June 2015.
New Homes Sales
New built single family homes saw 1,054 closings in June, 19% above May and 21% above June 2014. While the last month of each quarter is often the strongest, this June was exceptional and the second highest month in the last 4 years, beaten only by December 2012 which was slightly higher at 1,082.
The total dollar value of single family new homes closed in June was up 25% from $293 million in 2014 to $366 million in 2015.
The average sq. ft. of a new single family home in April was 2,607 while the average sq. ft. of a normal re-sale was 2,075. The fact that the average new home was 26% larger than the normal re-sale confirms the extent to which homebuilders have abandoned the entry-level market in favor of the move-up market. It also shows us why the median sales price of new homes is so much higher than for normal re-sales, even though the average price per square foot is almost identical – between $136 and $137.
The market share for new single family homes was just over 11%, the same as in June 2014.
Demand
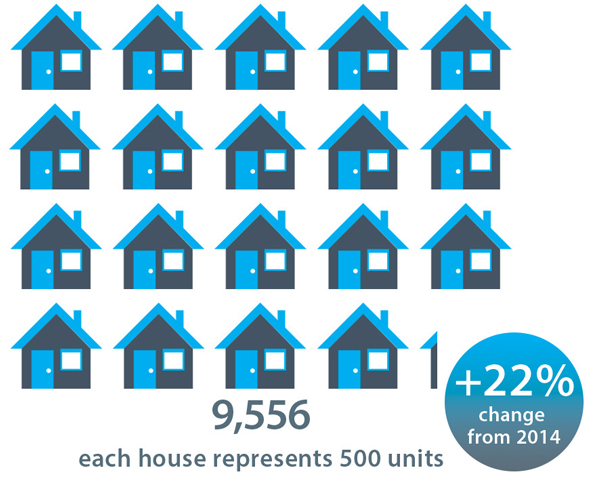
Total single family, townhouse & condo sales were 23% higher than June 2014, with single family homes up 22% and townhouse & condo sales up 30%. Townhome and condo market share was 14.0%, up from 13.2% last year. Homes priced over $500,000 took 24% dollar market share, down from 25% last year. Homes under $200,000 lost market share from 25% to 22%, while the mid range between $200,000 and $500,000 rose from 50% to 54%.
Total price for single family homes sold in June
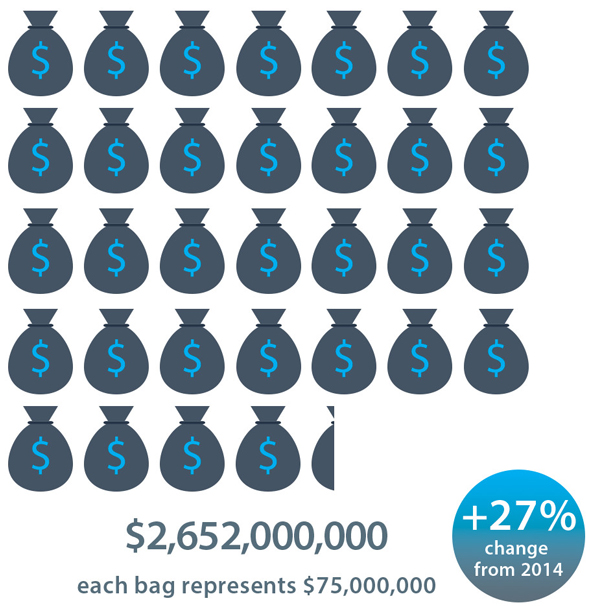
numbers reflect single family homes only
Total units for single family homes sold in June
Average Price Per Square Foot
Average price per square foot gained 4.8% from $126.81 to $132.92.
Supply
The number of active single family listings without an existing contract was 14,511 for the Greater Phoenix area as of July 1. This is down 4.1% since June 1. The inventory of single family homes under $150,000 stands at a very low 28 days, down from 50 days a year ago.
Overall we have seen 2% fewer new listings created in 2015 than at the same stage in 2014. Supply remains on a strong downward trend after accounting for seasonality.
Changes In transaction Mix
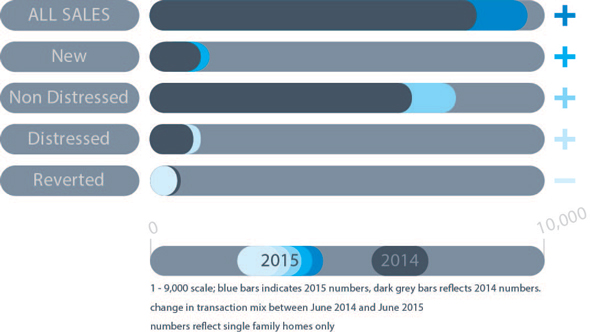
We saw growth in non-distressed transactions (26%) and new home sales (21%) as well as distressed transactions (up 10%). Reversions to lenders dropped 42% however.
Outlook
June gave us an emphatic confirmation that demand is healthy again in Greater Phoenix. A 22% increase in sales compared with June 2014 should put any doubt to rest. We expect July and August to be significantly less active, as is usually the case every year, but sales volume will probably still be much higher than in 2014. We expect the price gains that took place between January and June to be followed by a period of consolidation and it may be October before prices are able to gain upward momentum again. However the overall supply shortage is not compatible with any significant downward trend in pricing, so any weakness over the next few months is likely to be temporary.
Please visit http://research.wpcarey.asu.edu/real-estate/residential-overview/ for a complete breakdown of the current real estate housing market.