Market Update January 2015
Data supplied by Michael J. Orr, Director Center for Real Estate Theory and Practice
W.P. Carey School of Business
Arizona State University
Clear Title of Arizona is pleased to provide its clients with the Clear Connections Monthly Market Update. This report will provide you with the latest real estate trends.
Our business is built around the concept of educating and providing the personal service that Real Estate Agents and Lenders have come to depend upon. It is with this philosophy that we offer data from the ASU W.P. Carey School of Business to our clients, associates and friends. It is intended to keep you informed on critical market trends that affect our businesses.
Please visit http://research.wpcarey.asu.edu/real-estate/residential-overview/ for a complete breakdown of the current real estate housing market.
Introduction
Home sales in November (single family, townhouse & condo combined) were 21% lower than October, with a 21% decrease in single family homes while townhouse & condo sales were down 15%. As October had 6 more working days than November (23 versus 17) these drops are nowhere near as significant as they appear. It is fairer to compare with November 2013, but November 2013 did have 1 extra working
day compared with November 2014. Total sales were down 9% from November 2013 with single
family down 9% and townhouse & condo sales down 7%. Thanks to the change in the mix towards more expensive homes over the last twelve months, the drop in total dollars spent on single family homes was less severe than the drop in the unit count. The opposite was true of townhomes & condos:
- Total dollars spent on single family homes fell by 4.6% below November 2013.
- Total dollars spent on townhouses & condos fell by 8.1% below November 2013.
In the sections below we compare November 2014 data for Maricopa and Pinal County with that for November 2013. We analyze volumes and pricing for 8 different transaction types as well as the totals. Individual statistics are also provided in the attached tables by county and city. This report concentrates on single family homes but detailed statistics for townhouse/condo properties are shown in the tables
Demand
Demand has been much weaker since July 2013 and overall has shown little sign of recovery up to the end of November 2014. Activity by first time home buyers has been stubbornly and unusually low for the last year and is not compensating for the large loss in investor demand that had prevailed from 2009 until the middle of last year.
At the top end of the market sales of single family homes over $500,000 were flat compared with October 2013 but dollars spent rose 3%. Sales of single family homes below $150,000 fell 19%. Monthly sales in the mid-range between $150,000 and $500,000 were down 4% year over year.
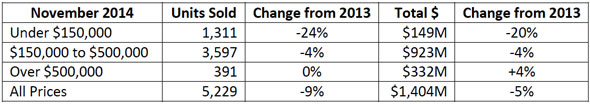
We still have a sales mix that is biased towards more expensive homes due to the large year over year fall in sales below $150,000. Luxury homes over $500,000 captured a 24% market share, up from 22% in November 2013. The lowest-priced homes under $150,000 fell from 13% to 11% of the market. The mid range has increased its share of spending from 65% to 66%. Supply has stabilized at a below average level, but is adequate to meet the low level of demand being experienced in the fourth quarter of 2014.
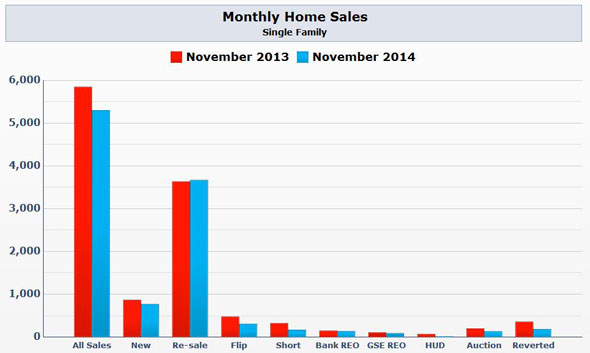
Changes in Transaction Mix
For single family homes, the substantial changes in transaction mix between November 2013 and November 2014 are illustrated in the chart below: (Note: ‘Reverted’ homes are excluded from ‘All Sales’.)
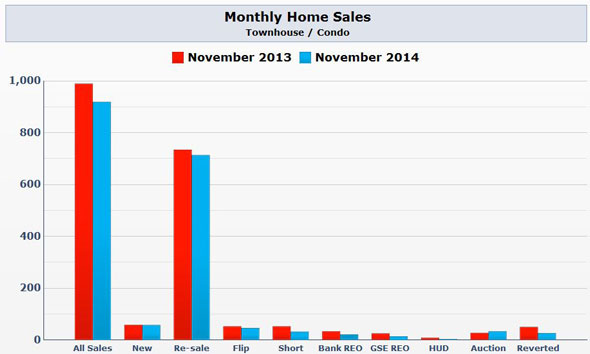
Below is a similar chart for townhouse /condo properties. We note an uptick in the previously very low level of new construction sales for townhouse/condos properties.
Supply
Our local Multiple Listing Service (ARMLS) had 25,939 active listings on December 1, 2014 across Greater Phoenix including listings under contract seeking backup offers. This is an fall of 0.1% since November 1, and it is only 1.6% more than on December 1, 2013, which is the lowest annual increase in the last 16 months. 10.9% of these active listings already have a signed contract, typically waiting for the lender’s short sale approval or some other contingency before they stop soliciting backup offers. This
percentage is similar to the 10.8% we recorded 12 months ago.
The number of active single family listings without an existing contract was 18,705 for the Greater Phoenix area as of December 1. This is down 1.1% since November 1. The inventory of single family homes under $150,000 rose to 71 days, down from 79 days a year ago. Overall we have seen 1.9% fewer new listings created this year than in the same 11month period in 2013. The rate of new listings arriving has dropped significantly since April and we are seeing fewer new listings than at the same time
in November 2013. Supply is on a declining trend after accounting for seasonality.
Pricing
When we look at the individual transaction types we find the following:
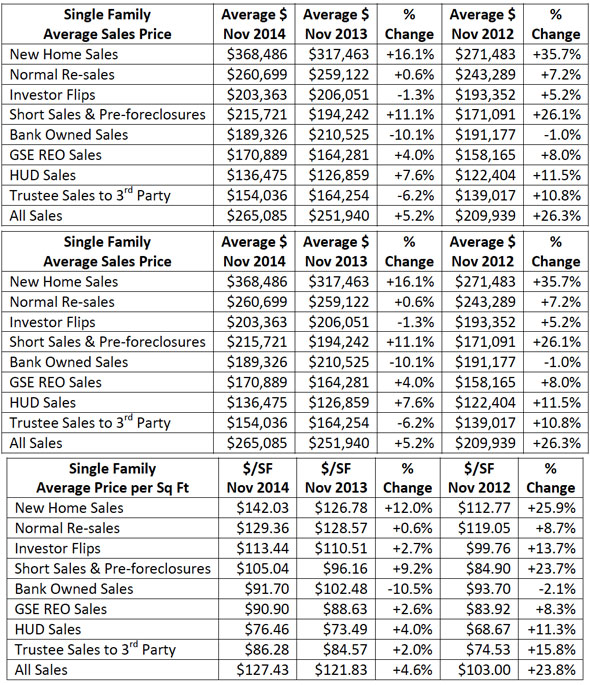
Note: the numbers in the tables above come from the latest database, rather than earlier published reports. The underlying records are continuously revised as deeds are corrected and more information becomes available.
Although we see advances in the pricing for “All Sales” these are primarily caused by changes in the mix rather than increasing home values.
- Fewer distressed homes and more normal sales
- More expensive homes and far fewer entry-level homes
Pricing in the new home segment is now being boosted by sales of homes in the newly opened Village at Mountain Shadows in Paradise Valley with a very high price per square foot. Excluding the 5 sales in Paradise Valley brings the average price per square foot down from $142.03 to $136.98, not much higher than the normal resale $/SF.
The market has clearly completed its recovery from the artificially low prices that prevailed between 2009 and 2011. Pricing is now only a little below the level that it would have attained if it had increased from 2000 in line with the Consumer Price Index. Further significant increases are unlikely without some growth in demand. However a significant fall in prices is also unlikely without a dramatic
increase in supply.
The following table ranks the cities by the percentage increase in the annual average price per sq. ft. over the last 12 months. The average for the period December 2013 to November 2014 is compared with the average for the period December 2012 to November 2013.
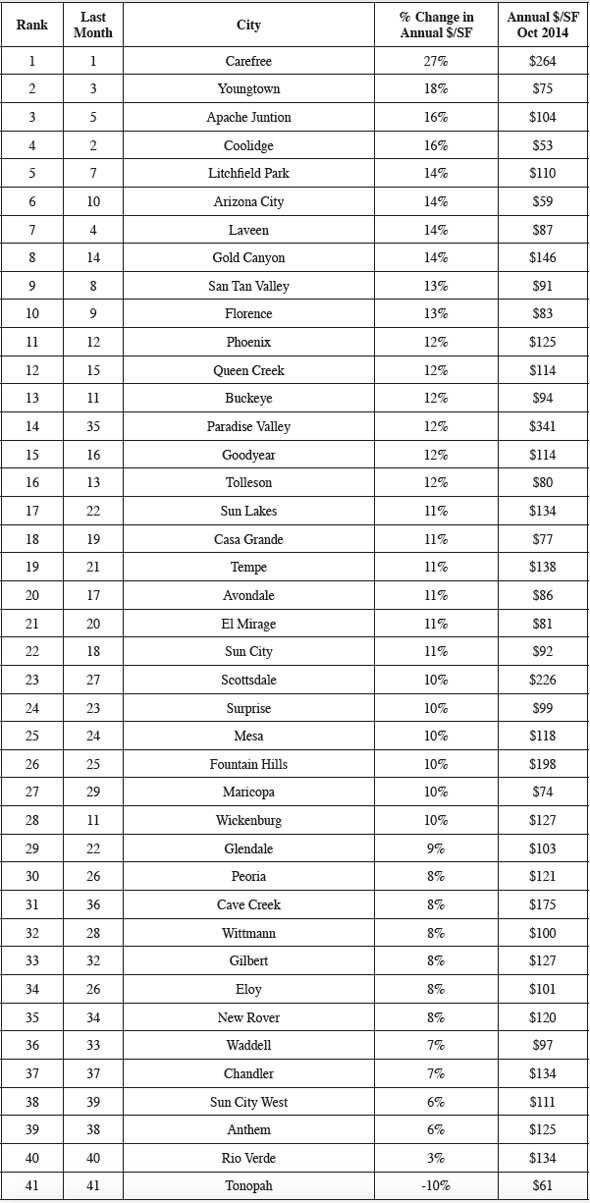
We must remember that a percentage increase in average sales price per square foot is not the same as a percentage increase in home values, because of the changes in the mix of homes that sell. Because these are annual averages they will continue to show increases long after the monthly average has stabilized.
All areas of Maricopa County except Tonopah are showing positive appreciation on an annual price per sq. ft. basis with the exception of 3 small areas: Aguila which is registering -33%, Guadalupe which registers -2% and Fort McDowell which is registering -12%. In Pinal County, Kearny, Mammoth and Winkelman are still recording negative appreciation.
Foreclosure Starts
Foreclosure starts for single family and condo/townhouse homes fell 33% between October and November, but this is mainly because trustees had only 17 working days in November versus 23 in October. They have now stabilized but are still drifting slightly lower. November 2014 was 44%
below November 2013 levels.
The breakdown by county and property type is:
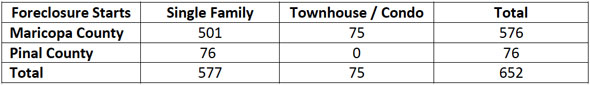
Foreclosure levels are far below the peak levels of March 2009, which were 10,099 in Maricopa and 1,256 in Pinal. In 2002 we averaged 1,160 per month for Maricopa County. Since the population has grown by about 25% since 2002, we would consider 1,450 foreclosure notices per month a normal level for Maricopa County, so we were 60% below that normal level in November. However this is primarily
due to the unusually low number of working days in the month.
We expect new foreclosures to stabilize close to the current low levels over the next year due to the very tight underwriting standards that have been in place since 2009.
Foreclosure Completions
We see a large drop in completed foreclosures when we compare November 2014 with November 2013.
- The number of completed trustee deeds is down by 39%
- The number of single family homes reverting to lenders is down by 48%
- The number of single family homes purchased by third parties at the auction is down by 33%
Completed foreclosures were down 28% from the October total, but once again this decrease was mostly due to the fact that November had 26% fewer working days for the trustees to file deeds. The number of pending foreclosures has fallen below a normal level and is now lower than in any year since 2001 with the sole exception of 2005. New foreclosure notices are proceeding to trustee sale quickly with little sign of any delay. It is noticeable that a higher percentage of homes are reverting to beneficiary so far in 2014, rather than being purchased at the trustee sale. This is primarily due to flagging investor interest, not higher opening bids set by lenders.
New Home Sales
Newly built single family home sales fell 16% from 922 recorded unit sales in October to 771 in November, the lowest monthly total since April. November was also down 11% from the same month in 2013. The total dollar value of single family new homes closed in November was down from $321 million in 2013 to $284 million in 2014. The average sq. ft. of a new home in November was 2,595
while the average sq. ft. of a normal re-sale was 2,015. This suggests the extent to which homebuilders have abandoned the entry-level market in favor of the move-up market. It also shows us why the median sales price of new homes is so much higher than for re-sales. The difference in average sq. ft. defeats the argument that new homes are over-priced. Gilbert retained its position as the top city for new home
closings with 111, and its nearest rival Peoria came in with 88. Other cities that are active for new homes include Mesa (75), Goodyear (61), Phoenix (69), Queen Creek (52), San Tan Valley (47), Buckeye (37), Surprise (35), Maricopa (24), Cave Creek (24) and Chandler (20). Builders were also busy in El
Mirage (16), Scottsdale (16), Casa Grande (14), Laveen (14), and Florence (12). The market share for new homes was 15% the same as in November 2013. Taylor Morrison ($287 million), Pulte ($253 million) and Meritage ($249 million) have closed the highest revenue for new homes during the first 11 months of 2014, with Shea Homes ($166 million), Lennar ($161 million) and Hovnanian ($143 million) behind them.
Normal Re-sales
Normal single family re-sales rose less than 1% from November 2013 to November 2014. The increasing share of the market for normal sales compared with last year is helping to boost the overall average price per square foot beyond the underlying rise in home values. However, the average sales price for normal re-sales is up only 0.6%, the median sales price is up 3% and average price per sq. ft. is up 0.6% over last year. This illustrates how weak the upward momentum in pricing really is. Normal re-sales have increased their market share to 69% from 62% a year ago and are by far the most numerous type
of sale.
Investor Flips
These are similar to normal re-sales in that there is no distressed owner, but we count them separately when the property was previously purchased with the obvious intent to resell at a higher price within a short period. Often the investor obtained a distressed property at a trustee sale (sometimes through a wholesaler), as an REO or as a short sale or pre-foreclosure. The investor usually refurbishes and
renovates the property and then sells the home somewhat below the price for normal sales in order to ensure it sells quickly.
Volume for investor flips has declined by 35% since November 2013. They represent 6% of total sales, down from 8% in November 2013. Short Sales and Pre-foreclosures Most lenders are still encouraging homeowners facing financial hardship to use short sales as a preferred alternative to foreclosure. However many have been insisting on higher contract prices before they will approve the sale and these
increased prices have reduced buyer enthusiasm, resulting in far fewer sales being completed than last year. In addition rising prices mean that fewer people are underwater on their mortgages, eliminating their need to negotiate short sales. As a result, short sales and pre-foreclosures are down 48% in volume since last year. They now represent 3% of single family home sales, having been 6% in November 2013.
Bank Owned Sales
Often referred to as REO sales, these are properties owned by commercial lenders following a completed foreclosure. If there are no bidders at the trustee sale the trustee issues a deed in favor of the beneficiary, i.e. the foreclosing lender, who subsequently liquidates the asset by marketing the property as a “bank owned home”. Sometimes the lender receives the property after a “deed in lieu of foreclosure” from the borrower, bypassing the trustee sale.
Between November 2013 and November 2014 REO sales have decreased by 8%. With less interest from investors at the trustee sales, more homes are going back to the banks for processing. However the overall numbers are still tiny compared with period from 2008 through 2012. In contrast to rises in the rest of the market, pricing for bank owned single family REOs is down significantly over the last 12
months. Bank owned REOs now represent 2.6% of the market, the same as in November 2013.
Fannie Mae / Freddie Mac / VA Sales Similar to Bank Owned Sales except the entity receiving the
foreclosed home is a government sponsored enterprise (GSE) rather than a commercial lender. Between November 2013 and November 2014 these REOs have decreased 20% in volume. Sales $/SF pricing for GSE single family REOs is up only 2.6% over the last 12 months, but this is a lot better than Bank
Owned Sales pricing. GSE REOs now represent 1.7% of the market, down from the 1.9% that we saw in November 2013.
HUD sales
If a bank receives a property through foreclosure where the loan had been guaranteed by FHA, the lender will usually deed the property to HUD for disposal. At an average $76.46 per sq. ft. they remain priced lower than all other sources of single family homes. HUD sales were common during the
housing crisis of 2008-2012 but unfortunately for bargain hunters, HUD homes are now very scarce and they currently represent just 0.3% of sales. It therefore becomes clear why FHA can afford to drop its mortgage insurance premiums, as announced by President Obama on January 8.
Third Party Purchases from Trustee Sales
Foreclosures used to provide a significant supply of homes for those willing to bid at the trustee auction, but the number auctioned has dropped significantly. During November 2014, there were 136 single family homes purchased by third parties at trustee sales, 119 in Maricopa and 17 in Pinal. Despite the lower numbers available, competition for auctioned homes is not high as many investors have lost their
appetite for acquisition and prices have stabilized as a result. Average price per sq. ft. has risen just 2.0% over the last 12 months. At 2.6% of the market, they are down from 3.5% in November 2013.
Reverted to Lender (i.e. Beneficiary)
If the lender sets an opening bid which is too high to attract any bids then the home is deeded to the lender. The outstanding loan debt is removed usually with no recourse (under Arizona law) to the original borrower. Most other liens (but not necessarily all) are also eliminated at this time.
When the lender is not interested in disposing of the property through the trustee sale, the opening bid is often set to be the outstanding loan balance plus expenses, usually well in excess of current market value. As such the bid has little relevance to us and we do not record it as a sale. However if the lender wishes to avoid acquiring the home, a low opening bid is set which attracts the interest of third
parties. Over the last 12 months, the number of reversions to beneficiaries has dropped by 48% for single family homes. There were 358 in November 2013 and 186 in November 2014.
New Construction Permits
Permits reported by the Census Bureau for single family homes in Maricopa and Pinal Counties dropped 22% from 810 in October to 627 in November. This was 6% lower than November 2013 and the lowest total since December 2011. The level of permitting remains very small by historic standards. For example the total for 1996 was 29,598 and 2004’s was 55,858.
The rolling 12 month average number of permits reported stands at 974. The annual rate is now 11,688. This is lowest rate since October 2012, more than 2 year ago. Multi-family permits have been on a strong upward trend recently although they are very volatile and totaled a modest 416 in November. This was enough to raise the annual rate to 8,791, a sign of how much rental demand has increased at the expense of the demand for homes to purchase.
Out of State Purchasers
The percentage of residences in Maricopa County sold to owners from outside Arizona was 16.6% in November, up from 16.0% in October and also higher than the 16.2% we saw in November 2013.
Californians have increased their market share from 3.5% to 4.7% over the last year and easily retained their normal position as the largest group of out of state buyers. Canadian demand has dropped from 2.3% to 1.6% over the last 12 months, but this represents a slight recovery from the lows over the summer period. Next in line come Washington (1.1%), Illinois (1.0%), and Colorado (1.0%). Minnesota,
Texas, Wisconsin and Utah were the next most numerous home locations for out of state home buyers in Greater Phoenix during November.
Cash Buyers
For some considerable time, cash purchases have been running at an unusually high level but this had been on a declining trend from February 2012 to August this year. This trend has reversed again and cash purchases are once again gaining market share. In Maricopa County the percentage of properties recording an Affidavit of Value and purchased without financing was 24.1% in November 2014, up from 23.9% in September and 20.7% in July. However it is still down from 27.1% in
November 2013. We consider 7% to 12% the normal range for cash buyers, so mortgage lending still has a long way to go to get back its normal share of the market. It will probably require financed purchases to rise to at least 80% to see demand moving significantly back towards normal. October 2008 was the last time we saw that level.
Investor Purchases
When someone buys real property in Arizona, an Affidavit of Value is usually recorded by the county. The new owner indicates whether the property will be occupied by the owner or a family member, or instead will be rented to someone other than a family member. An owner occupier also indicates whether or not it is their primary residence or a secondary home. Studying this information gives us a good idea how many homes are being acquired by investors.
However affidavits are not required for HUD sales or trusteesales. HUD sales are usually oriented towards owner occupiers while investors dominate the trustee sales. We have therefore combined HUD sales with the owner-occupied purchases and combined trustee sales to third parties with
the investor purchases to estimate the percentage of the total market represented by investors.
The percentage of individual single family and townhouse/condo parcels acquired by investors in November 2013 and November 2014 are as follows:
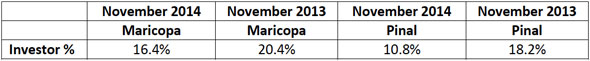
These percentages have dropped dramatically since 12 months ago, but have started to recover over the last 4 months. Investor buying is particularly low in Pinal County compared with the last several years. Most of the activity is coming from fix and flip operators and the fix to rent investors are much less active than in 2012 and early 2013.
Second Homes
In November 2014, 11.8% of homes purchased with an Affidavit of Value in Greater Phoenix were owner-occupied but used as second or vacation homes. The percentage in Pinal County is much higher (17.6%) than in Maricopa County (11.2%). Second home purchases made up 12.1% of sales in
November 2013, so we are seeing a similar level of second home activity as last year. This percentage tends to drop between April and October each year, which probably has something to do with Arizona’s weather.
Rentals
The number of rental homes offered for lease on ARMLS (excluding vacation rentals) was 4,496 as of December 1, 2014. This is down 2.4% from a month earlier and represents 1.6 months of supply. Rental demand remains strong and supply is constrained, though a little more plentiful than at
any time during the last 7 months.
There were 6,352 active rental listings as of December 1, 2013 one year earlier, which represented 1.9 months of supply. The supply of single family rentals is generally lower relative to demand than for apartments, condos and townhomes. The supply of single family rentals was 46 days as of December 1,
while that for apartments, condos and townhouses stood at 55 days. The average time on market for a leased home (excluding vacation rentals) stood at 37 days, up from 35 days last month but lower than 47 days last year. With relatively fast turnover and low vacancy rates, rents have been increasing in the most popular locations. We are currently seeing a 4.8% rise over the last 12 months across the Greater Phoenix area.
Outlook
At first sight it looks as though sales volumes collapsed in November, but this is an illusion brought about by the quirks of the Gregorian calendar. With a weekend at either end and Veterans Day and Thanksgiving in between, November had only 17 working days, the lowest we ever see for a calendar
month and 2 less than February 2014. This was compounded by October having the maximum number of working days we ever see – 23. A 26% reduction in working hours for title companies, lenders and trustees is bound to have a big effect on volumes.
In reality there was very little change in the Greater Phoenix housing market between October and November and stability remains the order of the day. Usually when demand for homes to buy is weak for an extended period, supply starts to grow, as it did in the second half of 2005 and throughout 2006 and 2007, heralding the collapse of the housing bubble. Things were very different in 2014. Supply
did increase during the early fall but did not grow during November, which is a definite sign of weak supply. Sellers are apparently losing enthusiasm while buyers are starting to show tiny signs of increased interest.
Price increases look tame over the last 12 months and even tamer if you examine just the last 6 months. Prices are particularly weak for distressed homes because investor interest is now weak and most buyers are looking for a home that does not need a lot of work. The sales mix continues to move away from less expensive homes and in favor of luxury homes. When we adjust for sales mix changes, there is not
much real upward price momentum greater than the general level of inflation, which is under 2% per year. However there is also little downward pressure either, thanks to the weakness in supply.
To get our market back to what we would consider normal will require a significant increase in demand from local first time home buyers. In November 2014 this was conspicuously absent, but we anticipate some life returning to the entry level market in 2015. We are seeing an increasing number of changes that should increase demand, including
- Reduced down payments to 3% for certain Fannie Mae & Freddie Mac conventional loans
- Reduced mortgage insurance premiums for FHA loans
- Continued falls in mortgage interest rates for all types of loans
None of them are vastly significant when considered alone, but when combined they are likely to cause 2015 to see stronger sales than 2014. Any increase in demand will probably have to come from domestic
buyers because the dramatic rise in the value of the dollar against most foreign currencies is liable to dampen demand from overseas.
It would not take much of an increase in demand to overwhelm the current weak level of supply and if this occurs we should expect prices to start rising once more. We will have to wait and see how first time home buyers react to the new lending environment in 2015.