Market Update June 2015
Clear Title of Arizona is pleased to provide its clients with the Clear Connections Monthly Market Update. This report will provide you with the latest real estate trends.
Our business is built around the concept of educating and providing the personal service that Real Estate Agents and Lenders have come to depend upon. It is with this philosophy that we offer data from the ASU W.P. Carey School of Business to our clients, associates and friends. It is intended to keep you informed on critical market trends that affect our businesses.
Please visit http://research.wpcarey.asu.edu/real-estate/residential-overview/ for a complete breakdown of the current real estate housing market.
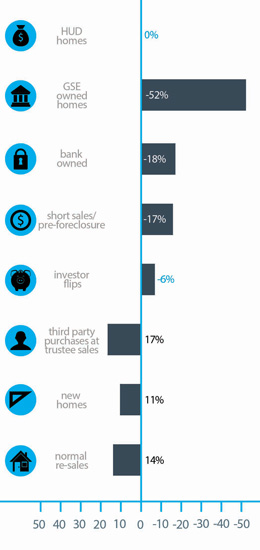 Single family homes sales increased year over year in three sectors:
- Normal re-sales (up 14%)
- New homes (up 11%)
- Third party purchases at trustee sale (up 17%)
Single family home sales decreased year over year across four sectors:
- Investor flips (down 6%)
- Short sales and pre-foreclosures (down 17%)
- Bank owned homes (down 18%)
- GSE (Fannie Mae, Freddie Mac, etc.) owned homes (down 52%)
Single family home sales were flat in one sector
- HUD sales (no change)
The change in total dollars spent on homes was more favorable than the change in the unit count.
- Total dollars spent on single family homes rose by 14% above April 2014.
- Total dollars spent on townhouses & condos rose by 19% above April 2014.
Overall pricing for single family homes has been very stable for much of the last year, but is starting to gain upward momentum again.
Median Sales Price
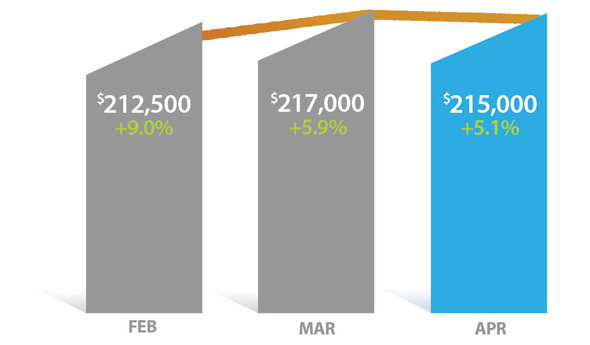
The median sales price was up 5.1% from $204,514 to $215,000
New Homes SalesNewly built single family homes saw 785 closings in April, 14% below March but 11% higher than April 2014. The total dollar value of single family new homes closed in April was up 17% from $245 million in 2014 to $286 million in 2015.
The average sq. ft. of a new single family home in April was 2,564 while the average sq. ft. of a non-distressed re-sale was 2,021. The fact that the average new home was 27% larger than the typical resale confirms the extent to which homebuilders have abandoned the entry-level market in favor of the move-up market. It also shows us why the median sales price of new homes is so much higher than for re-sales, even though the price per square foot is very similar.
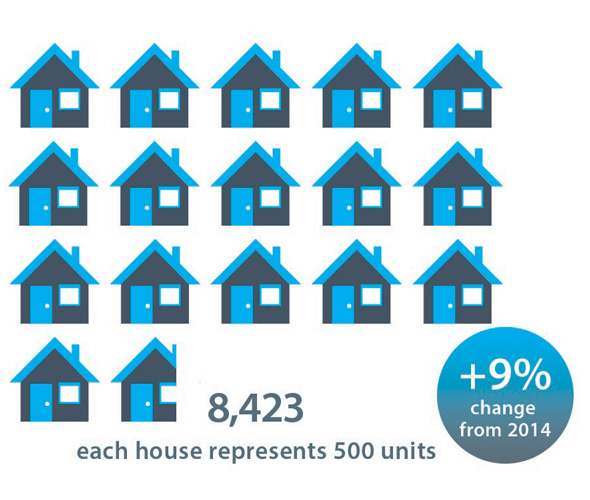
The market share for new single family homes was only 9%, the same as in April 2014.
Demand
Total single family, townhouse & condo sales were 9% higher than April 2014, and both single family homes and townhouse & condo sales were up by the same 9%. Townhomes and condos market share was 15.2%. Homes priced over $500,000 retained 26% dollar market share. Homes under $200,000 lost market share from 25% to 23%, while the mid range between $200,000 and $500,000 rose from 49% to 51%.
Total price for single family homes sold in April
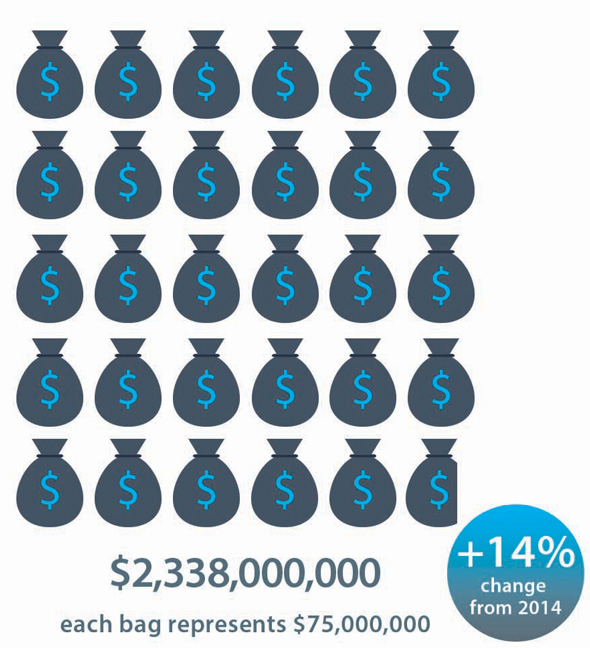
numbers reflect single family homes only
Total units for single family homes sold in April
Average Price Per Square Foot
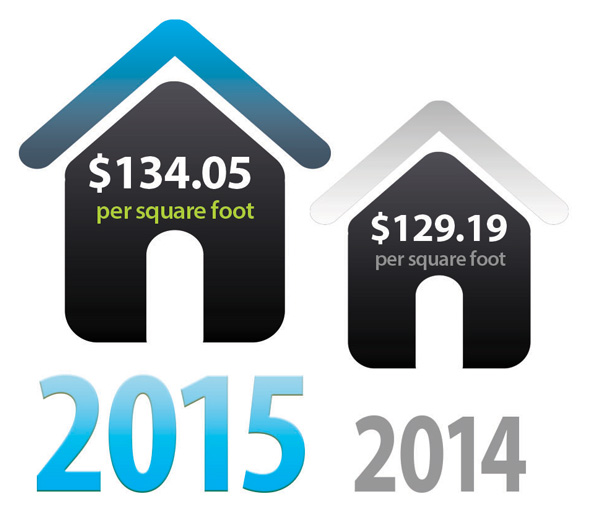
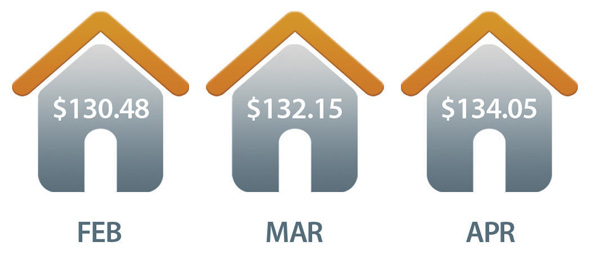
Average price per square foot gained 4.1% from $129.31 to $134.05
Supply
The number of active single family listings without an existing contract was 16,036 for the Greater Phoenix area as of May 1. This is down 3.7% since April 1. The inventory of single family homes under $150,000 stands at a very low 28 days, down from 54 days a year ago.
Overall we have seen 3% fewer new listings created in 2015 than at the same stage in 2014. Supply remains on a strong downward trend after accounting for seasonality.
Changes In transaction Mix
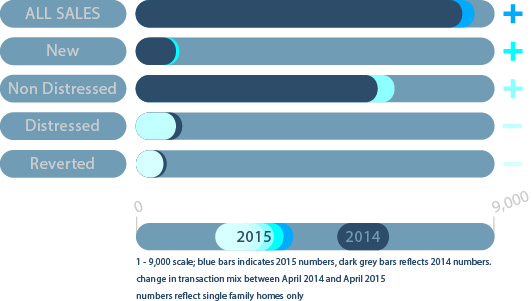
We saw growth in normal transactions (12%) and new home sales (11%) at the expense of distressed transactions (down 17%).
Outlook
Demand was weak throughout 2014 and until the end of January this year. However it suddenly recovered in February and April’s numbers in this report confirm this was no anomaly.
The second quarter of 2015 is already certain to be a much stronger housing market than the second quarter of 2014. The third quarter is less certain because demand from owner occupiers tends to die down once temperatures exceed 100 degrees. Investors keep going throughout the summer months, but investor buying is at the lowest level that we have seen for several years. We will be watching to see if we experience the usual lull between July and September, or whether the momentum from the spring buying season can be maintained.
Please visit http://research.wpcarey.asu.edu/real-estate/residential-overview/ for a complete breakdown of the current real estate housing market.