Market Update May 2015
Data supplied by Michael J. Orr, Director Center for Real Estate Theory and Practice
W.P. Carey School of Business
Arizona State University
Clear Title of Arizona is pleased to provide its clients with the Clear Connections Monthly Market Update. This report will provide you with the latest real estate trends.
Our business is built around the concept of educating and providing the personal service that Real Estate Agents and Lenders have come to depend upon. It is with this philosophy that we offer data from the ASU W.P. Carey School of Business to our clients, associates and friends. It is intended to keep you informed on critical market trends that affect our businesses.
Please visit http://research.wpcarey.asu.edu/real-estate/residential-overview/ for a complete breakdown of the current real estate housing market.
Single Family Homes…sales increased year over year in three sectors:
- Normal re-sales (up 25%)
- New homes (up 12%)
- Third party purchases at trustee sale (up 13%)
Single family home sales decreased year over year across the remaining sectors:
- Investor flips (down 20%)
- Short sales and pre-foreclosures (down 16%)
- Bank owned homes (down 12%)
- GSE (Fannie Mae, Freddie Mac, etc.) owned homes
- (down 58%)
- HUD sales (down 19%)
The change in total dollars spent on homes was even more favorable than the change in the unit count.
- Total dollars spent on single family homes rose by 20% above March 2014.
- Total dollars spent on townhouses & condos rose by 31% above March 2014.
In the single family market we see that average price per sq. ft. went up 2.2%, which is more than the three individual categories. Overall pricing for single family homes has been very stable over the last year, but is starting to move upwards again.
Median Sales Price
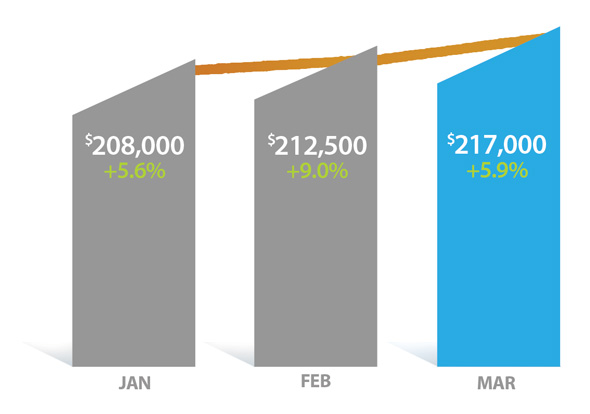
The median sales price was up 5.9% from $204,900 to $217,000
New Home Sales
Newly built single family homes saw 910 closings in March, a 32% improvement over February and 12% higher than March 2014. The total dollar value of single family new homes closed in March was up 15% from $285 million in 2014 to $328 million in 2015.
The average sq. ft. of a new single family home in January was 2,640 while the average sq. ft. of a non-distressed re-sale was 2,018. The fact that the average new home was 31% larger than the typical resale confirms the extent to which homebuilders have abandoned the entry-level market in favor of the move-up market. It also shows us why the median sales price of new homes is so much higher than for re-sales, even though the price per square foot is very similar.
The market share for new single family homes was 11%, down from 12% in March 2014.
Demand
Total single family, townhouse & condo sales were 17% higher than March 2014, with a 16% rise in single family homes while townhouse & condo sales were up 27%. Townhomes and condos gained market share from 14.3% to 15.5% compared with March 2014. Homes priced over $500,000 is no longer out-performing with a slight decline in dollar market share from 27% to 25% since last year. Homes under $200,000 also lost market share from 25% to 23%. The big increase came for the mid range between $200,000 and $500,000 where market share rose from 48% to 52%.
Total price for single family homes sold in March
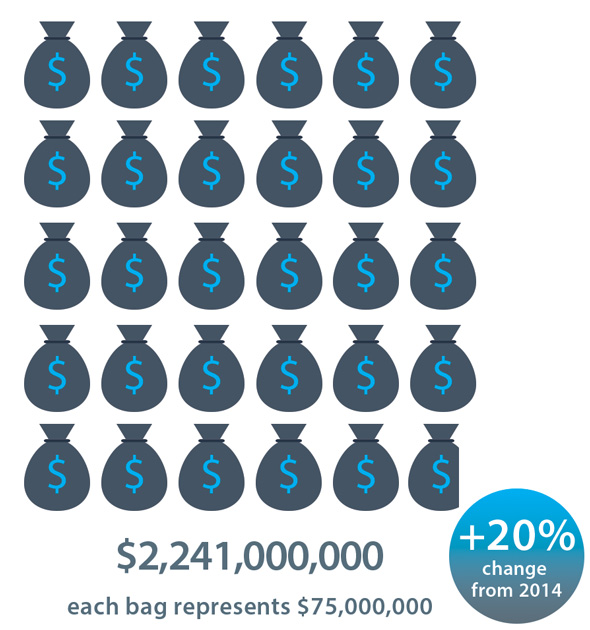
numbers reflect single family homes only.
Total units for single family homes sold in March
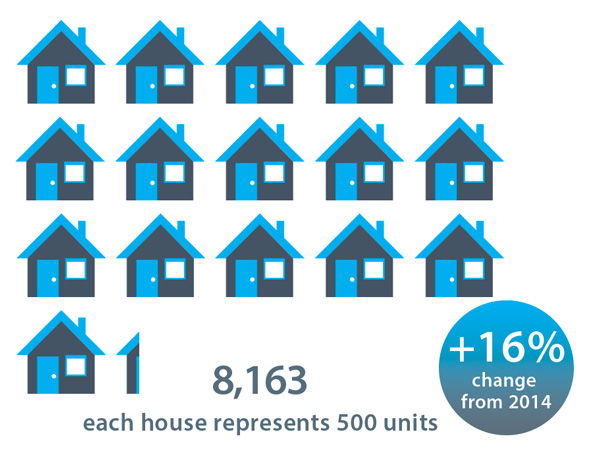
numbers reflect single family homes only.
Average Price Per Square Foot
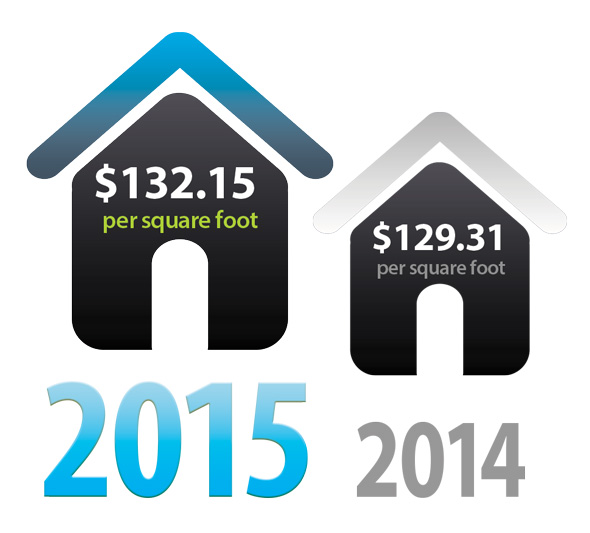
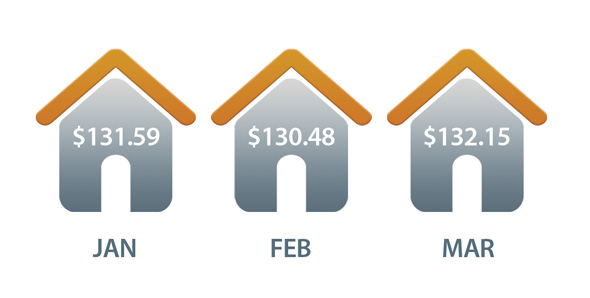
Average price per square foot gained 2.2% from $129.31 to $132.15
Supply
The number of active single family listings without an existing contract was 16,644 for the Greater Phoenix area as of April 1. This is down 6.1% since March 1. The inventory of single family homes under $150,000 stands at 34 days, down from 61 days a year ago.
Overall we have seen 3% fewer new listings created in 2015 than at the same stage in 2014. Supply remains on a declining trend after accounting for seasonality.
Changes in Transaction Mix
![]()
We saw growth in normal transactions (21%) and new home sales (12%) at the expense of distressed transactions (down 18%).
Outlook

Demand increased during March, especially for the mid range between $200,000 and $500,000, where 28% more money was spent on both single-family homes and townhouse/condos compared to a year earlier.
It is now very likely that the second quarter of 2015 will see a much stronger housing market than the second quarter of 2014. Many observers seem to believe interest rates must rise at some point. We believe such an increase will most likely be balanced by more favorable underwriting policies leading to wider availability of loans even if they are a little more expensive. We therefore do not expect a rise in interest rates to deflate the market. Instead we believe we will start to see a small swing back towards home ownership and away from renting.
Please visit http://research.wpcarey.asu.edu/real-estate/residential-overview/ for a complete breakdown of the current real estate housing market.